This article explains how to create ER diagrams from SQL SELECT statements.
Even when JOINs are complex and table structures are difficult to understand, you can visualize relationships using only SELECT statements.
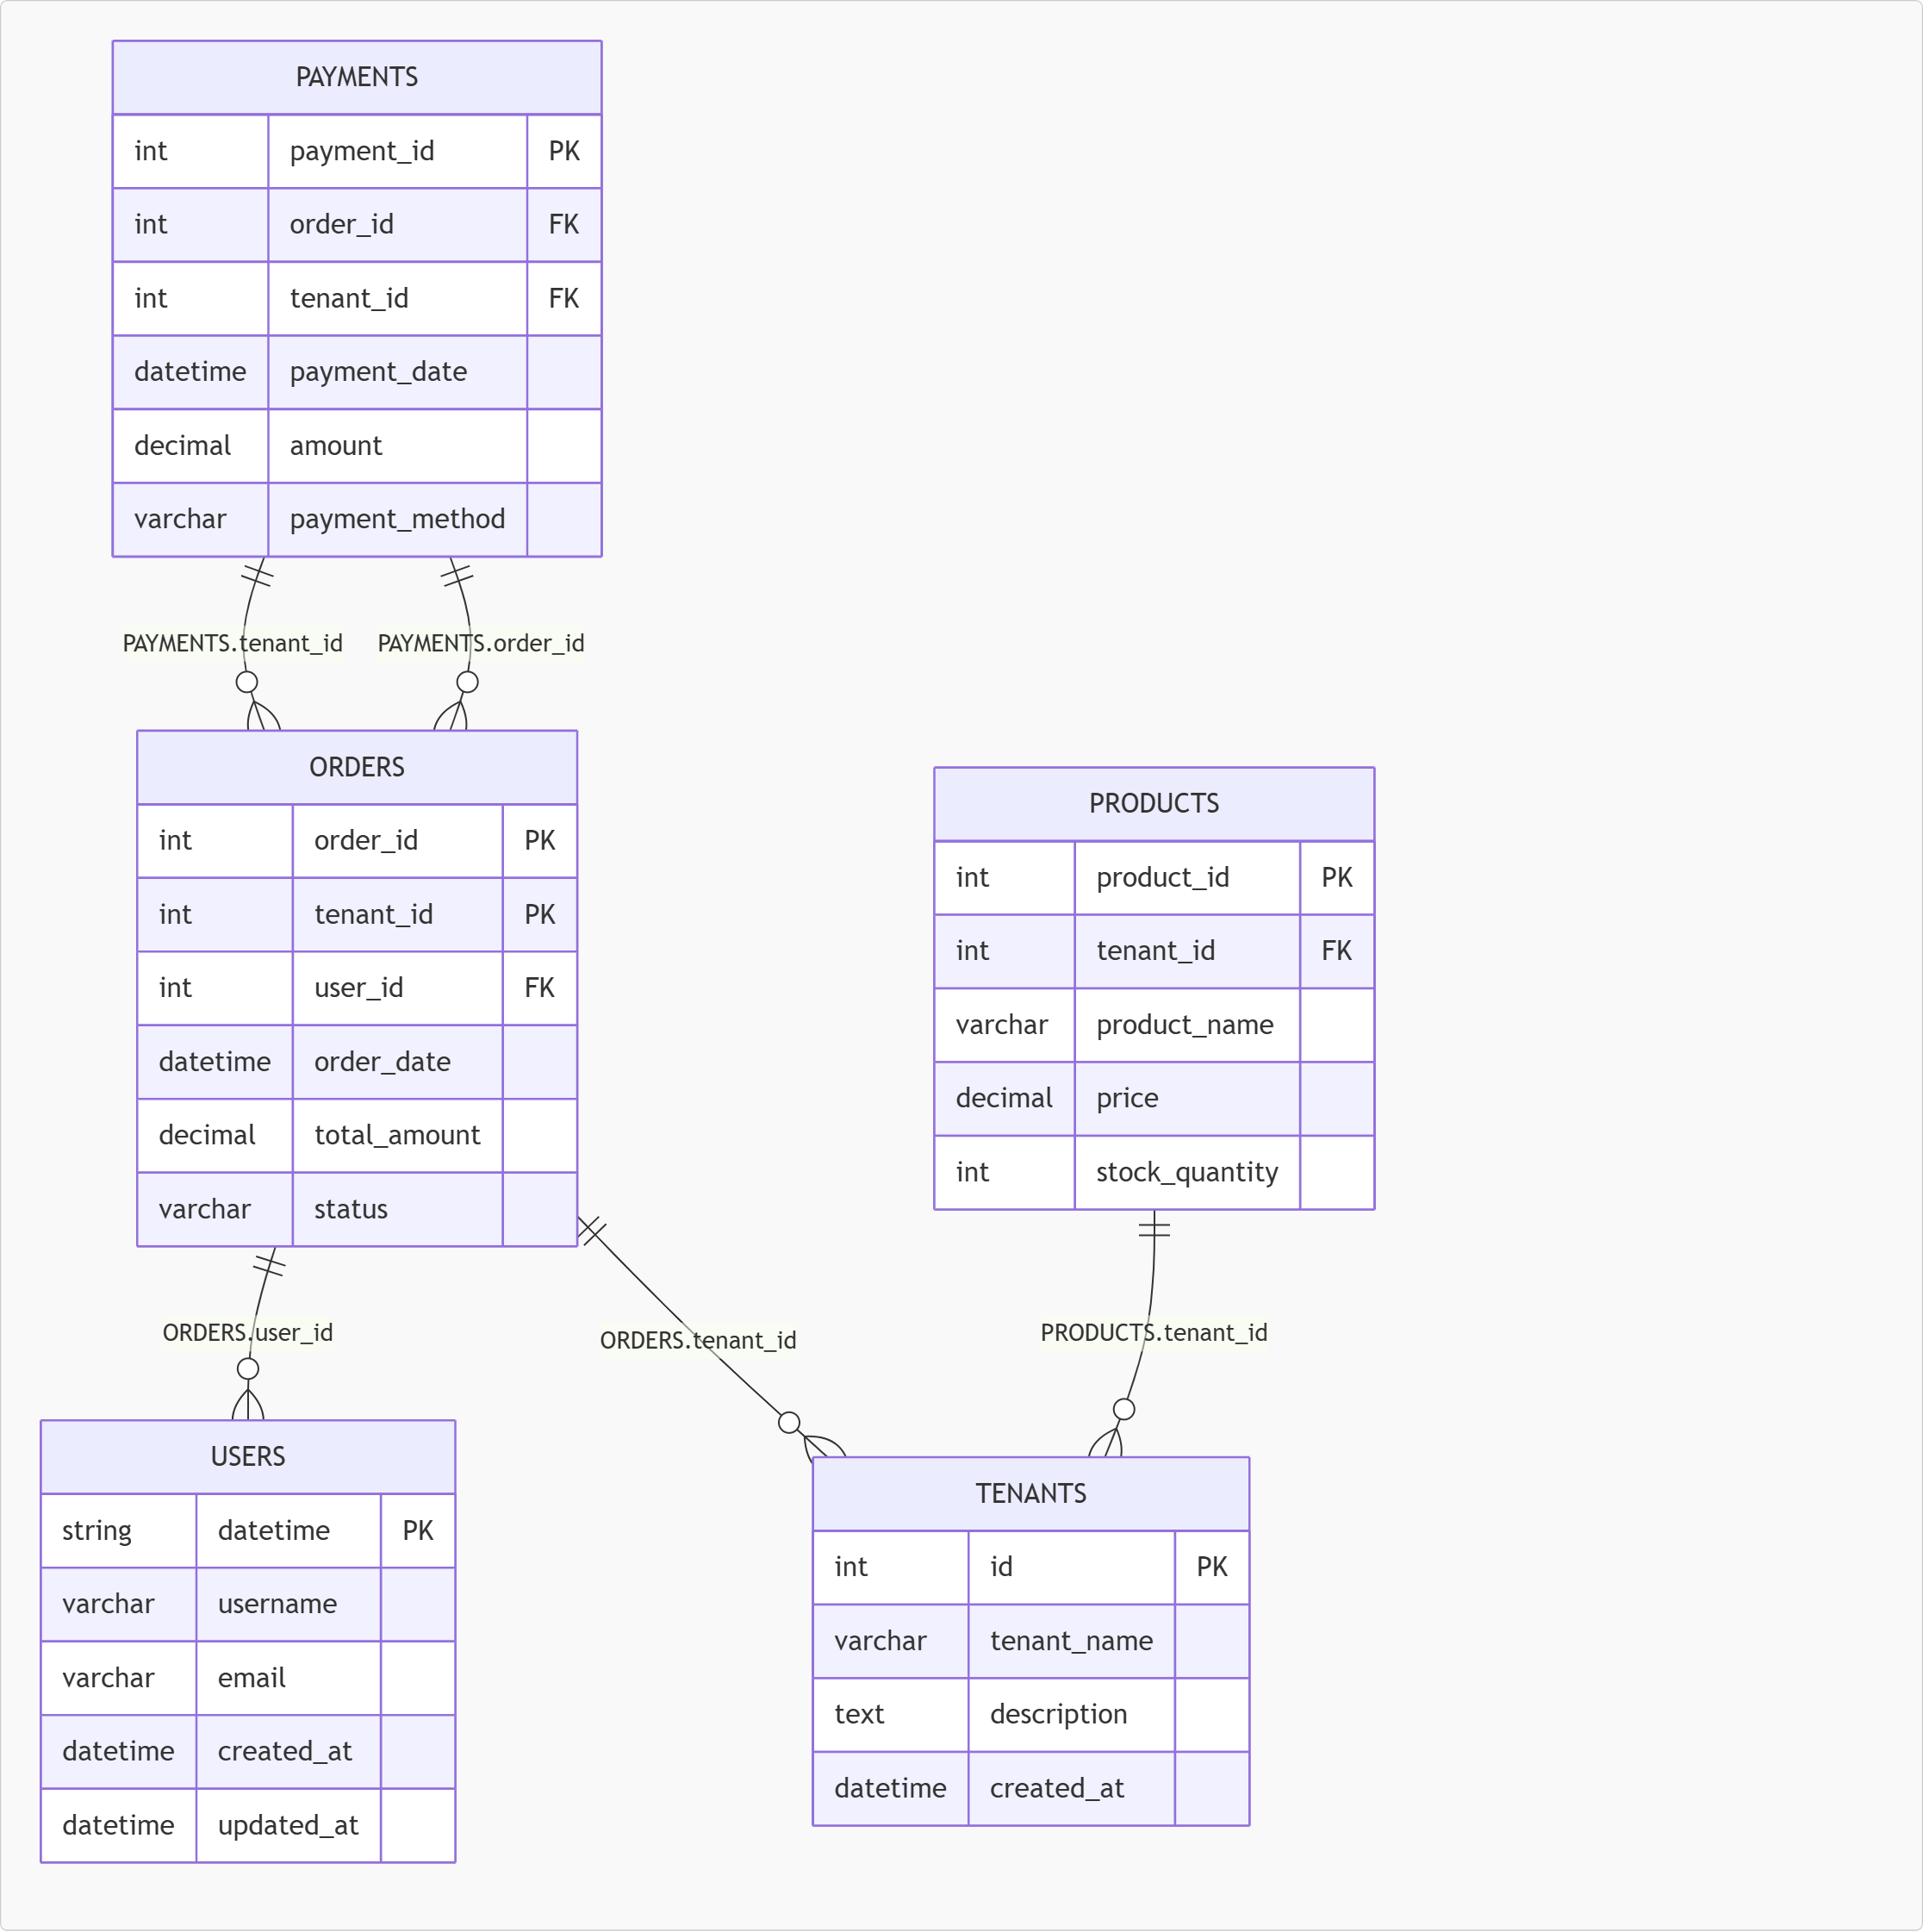
An ER diagram is a visual representation of a database's structure.
By representing these elements in a diagram, you can intuitively understand the structure of the data.
As the number of joined tables increases, it becomes difficult to understand the structure using only SQL. Having an ER diagram allows you to grasp the overall structure at a glance.
When modifying an existing system, having an ER diagram makes it easier to identify the impact range and reduce work costs.
You can visualize the structure using only the SELECT statements in front of you, without the need to search for table definitions.
By visualizing the structure, even non-engineers can understand it easily, which is helpful for onboarding new team members.
Typically, ER diagrams are created from DDL statements like CREATE TABLE, but it is also possible to infer relationships between tables from SELECT statements.
The reason is that SELECT statements explicitly specify the join conditions (relationships) between tables.
For example, consider the following SQL:
SELECT *
FROM users u
JOIN orders o ON u.id = o.user_id;
In this case,
u.id = o.user_id
is the condition specified.
This represents
represents the relationship between the tables.
In other words, JOIN + ON clause = ER diagram line.
By analyzing the join conditions contained in the SELECT statement, it is possible to automatically generate an ER diagram.
JOIN is an SQL construct used to combine multiple tables and retrieve data.
By specifying join conditions, only data that matches the conditions is combined.
The basic syntax is as follows:
SELECT *
FROM TableA
JOIN TableB ON condition;
The "condition" defines the relationship between the tables.
SELECT *
FROM users u
INNER JOIN orders o ON u.id = o.user_id;
SELECT *
FROM users u
LEFT JOIN orders o ON u.id = o.user_id;
SELECT *
FROM users u
RIGHT JOIN orders o ON u.id = o.user_id;
JOIN is not just for data retrieval; it represents how tables are connected.
Therefore, by analyzing JOINs,
👉 it is possible to reconstruct the relationships between tables (ER diagrams)
in other words, JOINs can be used to generate ER diagrams.
The most important aspect of ER diagram generation is analyzing the ON clause.
The ON clause directly specifies the relationships between tables.
u.id = o.user_id
From this line, we can infer the following:
👉 Each side is a column from a different table
users.id ← parent
orders.user_id ← child
JOIN order_items oi ON o.id = oi.order_id
JOIN products p ON oi.product_id = p.id;
👉 You can analyze them one by one
👉 Analyze each condition separately
These issues can be resolved by using tools that automatically generate ER diagrams from SELECT statements.
Our site provides a tool that can automatically generate ER diagrams from SQL.
👉 The ER diagram generation tool is here
By utilizing this mechanism, it is possible to visualize table structures even without DDL.
Using SQL2ER, these can be automatically visualized
👉 Try it out
-ENGLISH.gif)